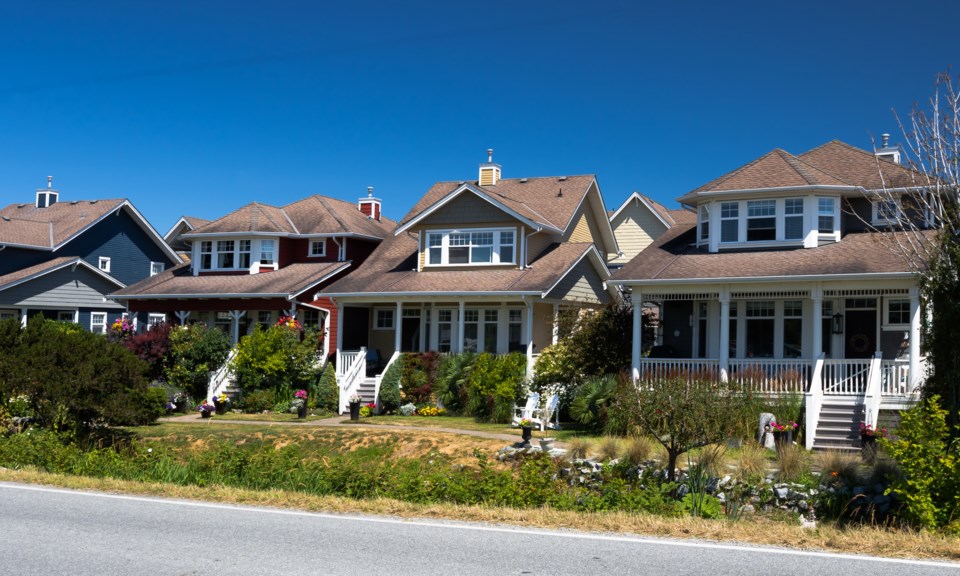
After a dismal spring so far, Metro Vancouver (including Squamish) residential real estate activity leaped by 44.2 per cent month over month to 2,638 homes sold in May, according to figures released June 4 by the Real Estate Board of Greater Vancouver (REBGV).
However, May is historically the busiest month of the year for home sales, and last month’s jump was from very low April figures. May’s transaction total is still 6.9 per cent lower than in May 2018, 22.9 per cent below the 10-year average for the month and the lowest May total since 2000.
Still, the new figures do mark a notable improvement over the 29.1 per cent annual sales drop seen in April 2019, which was 43.1 per cent below April’s 10-year average.
The board maintained its stance of attributing low demand to the mortgage stress test. “High home prices and mortgage qualification issues caused by the federal government’s B20 stress test remain significant factors behind the reduced demand that the market is experiencing today,” said Ashley Smith, REBGV president.
Despite the increased sales activity in May, it was not enough to offset all the new listings coming on to the market, and inventory continues to pile up. There were 5,861 homes newly listed last month, which is 8.1 per cent less than May 2018 but a 2.1 per cent increase compared with April. It’s also more than double the number of homes sold last month.
The total number of homes listed for sale on Metro Vancouver’s MLS is 14,685, a 30 per cent increase compared with May 2018 and up 2.3 per cent since April 2019. This is the highest number of homes listed for sale since September 2014, said the board.
However, the improved absorption rate meant that Metro Vancouver stayed firmly in a balanced market in May. For all property types, the sales-to-active listings ratio for May 2019 is 18 per cent. When broken down by property type, the ratio is 14.2 per cent for detached homes (returning to a balanced market, if maintained for several months), 20 per cent for townhomes and 21.2 per cent for apartments (both edging back toward seller’s markets, but again, only if this ratio is sustained).
Despite this, the generous supply of homes for buyers to choose from is pulling prices down, with the composite benchmark price of a home (all property types combined) across Metro Vancouver now at $1,006,400. This is an 8.9 per cent drop since May 2018, and a slim 0.4 per cent decline compared with April 2019.
Smith added, “Whether you’re a buyer looking to make an offer or a seller looking to list your home, getting your pricing right is the key in today’s market.”
Jason Turcotte, vice-president of development at Cressey Development Group, said, "The current market is reflective of a change in buyer sentiment. Prospective homebuyers are taking their time in purchasing; this doesn't mean the activity is not there, it just means they feel they have time on their side in this market."
Sales and prices by property type and area
Having taken the toughest beating so far, the single-family market saw the biggest improvement last month. Detached home sales across Metro Vancouver totalled 913 transactions, which is nearly 56 per cent higher than in April and only 1.4 per cent lower than in May 2018.
The benchmark price for a typical detached home in the region is $1,421,900, which is an 11.5 per cent decrease from May 2018 and a 0.5 per cent slip from April 2019.
As ever, West Vancouver and Vancouver West saw the sharpest annual drop in detached benchmark prices, down 16.6 and 14.5 per cent respectively. Single-family prices fell on an annual basis in all markets, but saw the least-steep declines in Whistler (-2.3 per cent) and Ladner (-2.9 per cent). Six of the board’s 20 areas saw detached prices rise since April: Whistler, Ladner, Burnaby North, and the three Tri-Cities areas of Port Moody, Coquitlam and Port Coquitlam.
The story is quite different in the attached home market. Attached homes such as townhouses and duplexes were the only property type to see a year-over-year sales increase – up 0.6 per cent to 479 total unit transactions across the region. That’s a 33.8 per cent increase compared with the previous month.
This home type was also the only one to see prices rise compared with the previous month. A typical attached unit in the region now goes for $779,400, which is a 7.6 per cent decrease from May 2018 but a 0.6 per cent increase compared with April 2019.
Ladner may be seeing better detached sales, but its townhomes slipped the most in benchmark price last month, down 15.8 per cent, followed by Tsawwassen (-13.8 per cent). Those two areas were also among just six local markets to see a month-over-month townhome price drop, along with New Westminster, Richmond, Whistler and Port Moody. All the other areas saw a slight uptick in benchmark townhome price over April.
Some 1,246 Metro Vancouver condos changed hands in May 2019, which is the steepest annual decline at a 12.9 per cent decrease compared with May 2018. However, it’s an impressive 40.8 per cent more condo sales than in April this year.
The benchmark price of a typical apartment property is now pegged at $664,200. This represents a 7.3 per cent decrease from May 2018, and a 0.5 per cent slide compared with April 2019.
Whistler and �鶹�����were the only MLS areas in the board’s jurisdiction to post a year-over-year condo benchmark price increase, up 4.3 and 1.3 per cent respectively. The steepest annual price drops for this property type were seen in West Vancouver – down a whopping 18.6 per cent – and Vancouver West, down 10.3 per cent.
Home prices vary widely in different areas throughout the region. To get a good idea of home prices in a specific location and by property type, check the detailed MLS® Home Price Index in the .


