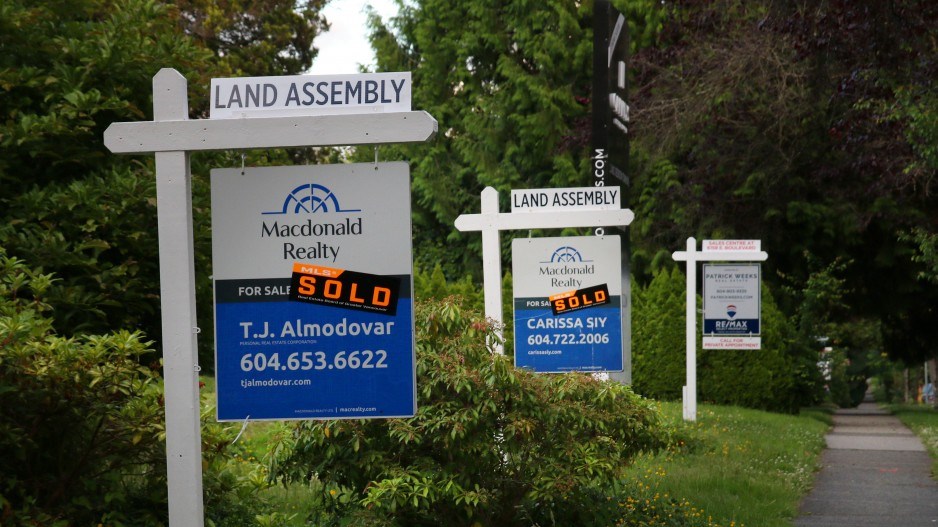
B.C.’s housing market saw a slight improvement in March as home sales nudged higher following a 5.9-per-cent decline in February. Sales increased 0.7 per cent to reach 5,866 unit sales. Home prices rose 1.8 per cent. This said, housing momentum has waned in the last few months as buyer sentiment shifted amid interest rate uncertainty.
MLS home sales increased in most of the province’s real estate board areas. The Greater Vancouver area saw home sales increase by 1.4 per cent following a decline in the previous month. In Chilliwack, home sales increased only slightly—by just 0.5 per cent—while the Kootenays reported a 17.2-per-cent increase. Home sales also rose 9.4 per cent on Vancouver Island, and were unchanged in the Fraser Valley. However, the Okanagan-Mainline and South Okanagan areas recorded sales declines of 8.9 per cent and 19 per cent, respectively.
Home values in B.C. increased in March to reach an average of $976,893. Prices have fluctuated since mid-2023, and are now 8.4 per cent below a historical peak in February 2022 and 2.5 per cent below the 2023 high.
The month-to-month gain from February to March was the result of higher prices in the Greater Vancouver region, where home values increased by 1.1 per cent—making up for a decline in February of 0.9 per cent. In both the South Okanagan and Okanagan-Mainline, home prices increased by 7.7 per cent and 2.9 per cent, respectively. The Fraser Valley also saw prices increase by 2.1 per cent while the Kootenays noted an 11-per-cent monthly increase. In Chilliwack, the average price rose by 0.7 per cent. In contrast, home values in Kamloops receded by 6.1 per cent while those on Vancouver Island declined by 0.5 per cent.
There was a drop in new residential listings in B.C. during March, following two consecutive monthly increases. During the month, new listings decreased by 2.5 per cent—a sign of sellers awaiting better market conditions. Meanwhile, B.C.’s sales-to-new-listings ratio increased to 46.2 per cent from 44.7 per cent, moving closer to a balanced market. Sales activity is expected to remain subdued into the late spring months. The possibility of rate cuts in the second half of the year might fuel stronger market activity.
On the construction front, building permits in B.C. continued to climb in February, increasing by 10.6 per cent following a 32.4-per-cent surge in January. The February increase was driven by residential and non-residential sectors, with construction intentions up by 5.9 per cent and 19.8 per cent, respectively. Year over year, total permit values soared by 44.6 per cent. While the 12-month moving average shows a down trend in permit issuances that has been ongoing since late 2022, the recent increase could point to a shift in activity.
The value of residential permits increased to $1.4 billion. Single-dwelling residential permits increased by 9.4 per cent and multi-family building permits rose by 5.1 per cent.
Non-residential permit values advanced to $804.9 million. Industrial permit values soared, up by more than 12 times their value in January, largely due to a permit issued for a new dairy processing facility in Abbotsford-Mission. Commercial permits rose by 16.3 per cent; government permits fell by 85.5 per cent.
Bryan Yu is chief economist at Central 1.


